Joining shapefiles to CSV data
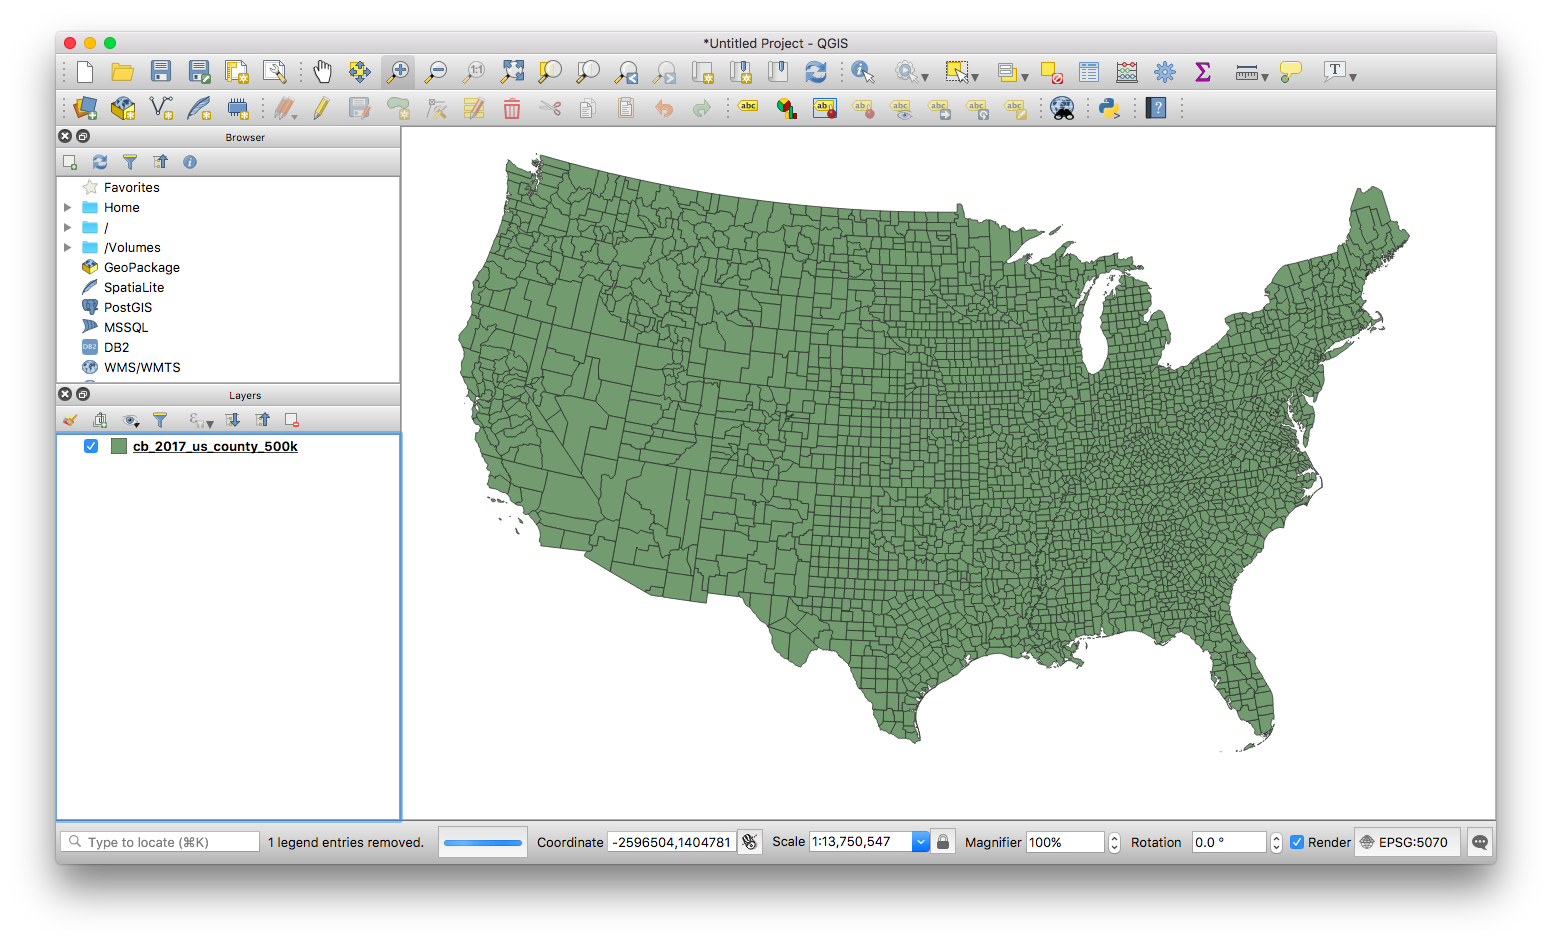
You start with two files, a CSV file and a shapefile. In order to join them need to make sure they have a column that match.
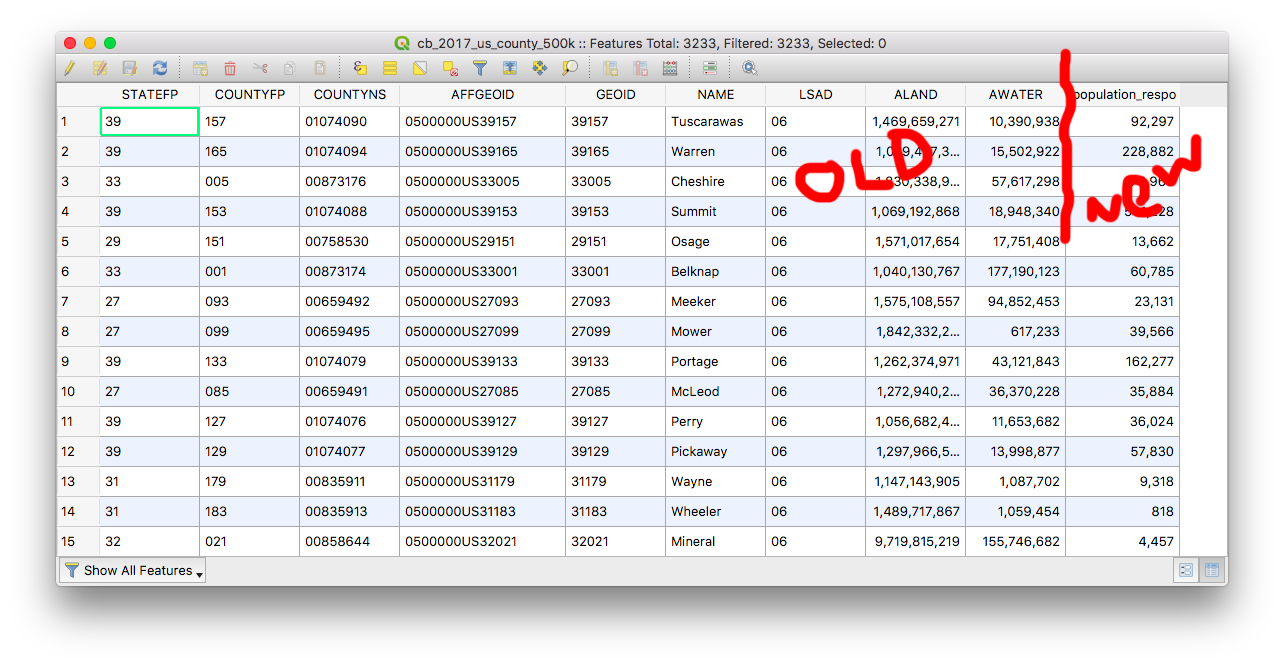
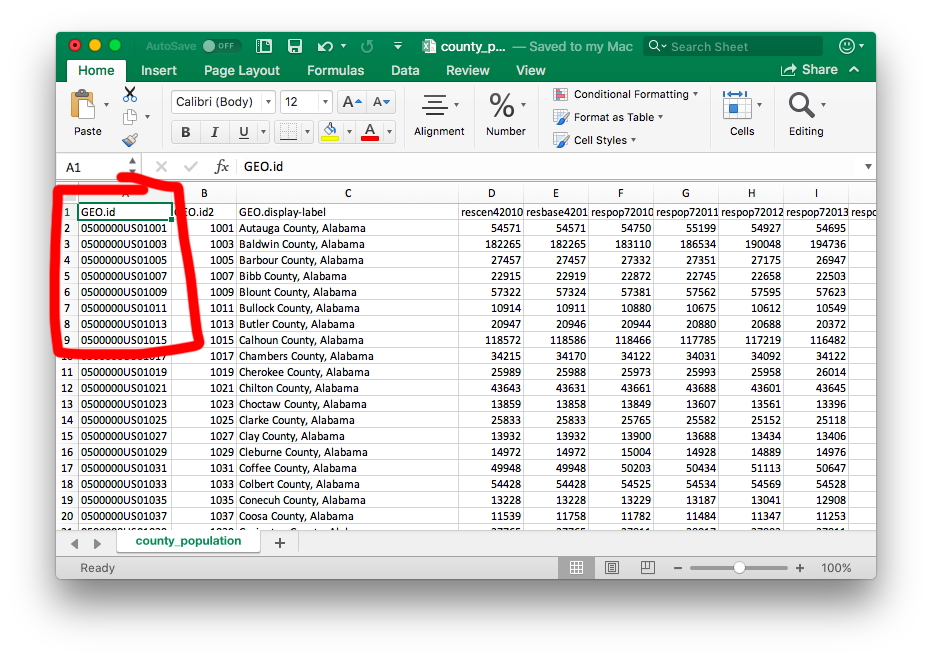
For example, they both might have the name of a state. You can look at a shapefile’s data using the Attribute Table (right-click the layer), and a CSV file’s data in, well, pandas or Excel or whatever.
In this example, we’re matching up US counties with population data. Our data has a Geographic ID set up by the Census Department.
In the spreadsheet it’s called GEO.id.
And in the shapefile it’s called AFFGEOID
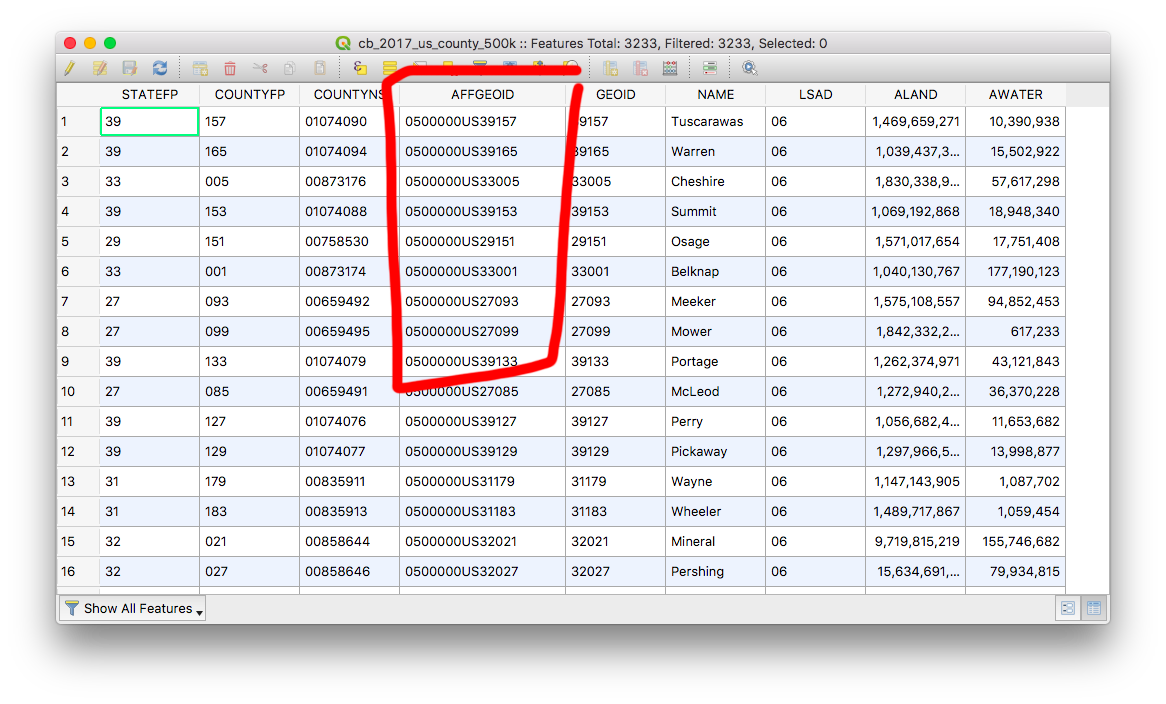
We’ll start by importing out shapefile (you probably already did this to check the columns).
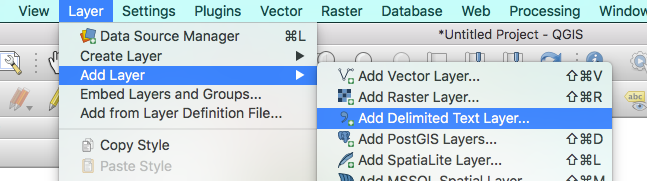
To add the CSV file, first we go to Layers > Add Layer > Add Delimited Text Layer from the top menu.
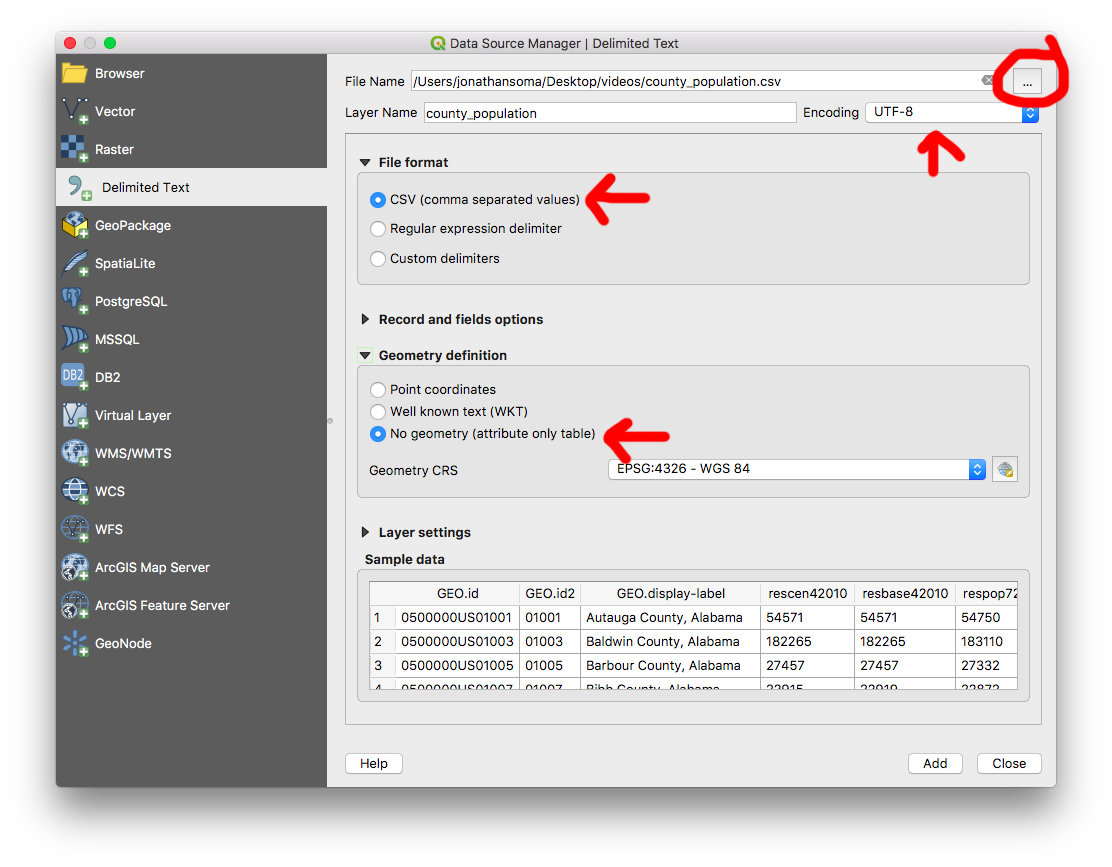
Use the browse button to find your file, select UTF-8 for the encoding (probably!), and make sure it’s a CSV. You’ll also want to specify No geometry, because this probably does not have latitude and longitude in it.
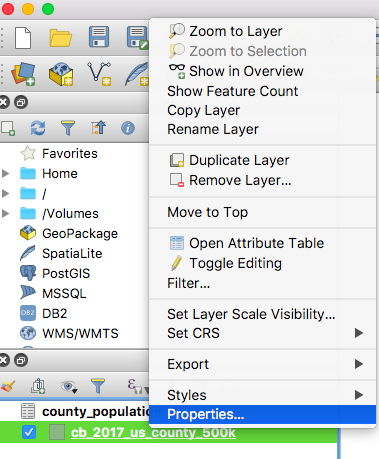
Once it’s added, we need to join the data with our existing shapefile. Right-click your shapefile and select Properties…
…and then go to the Joins section using the left-hand navigation.
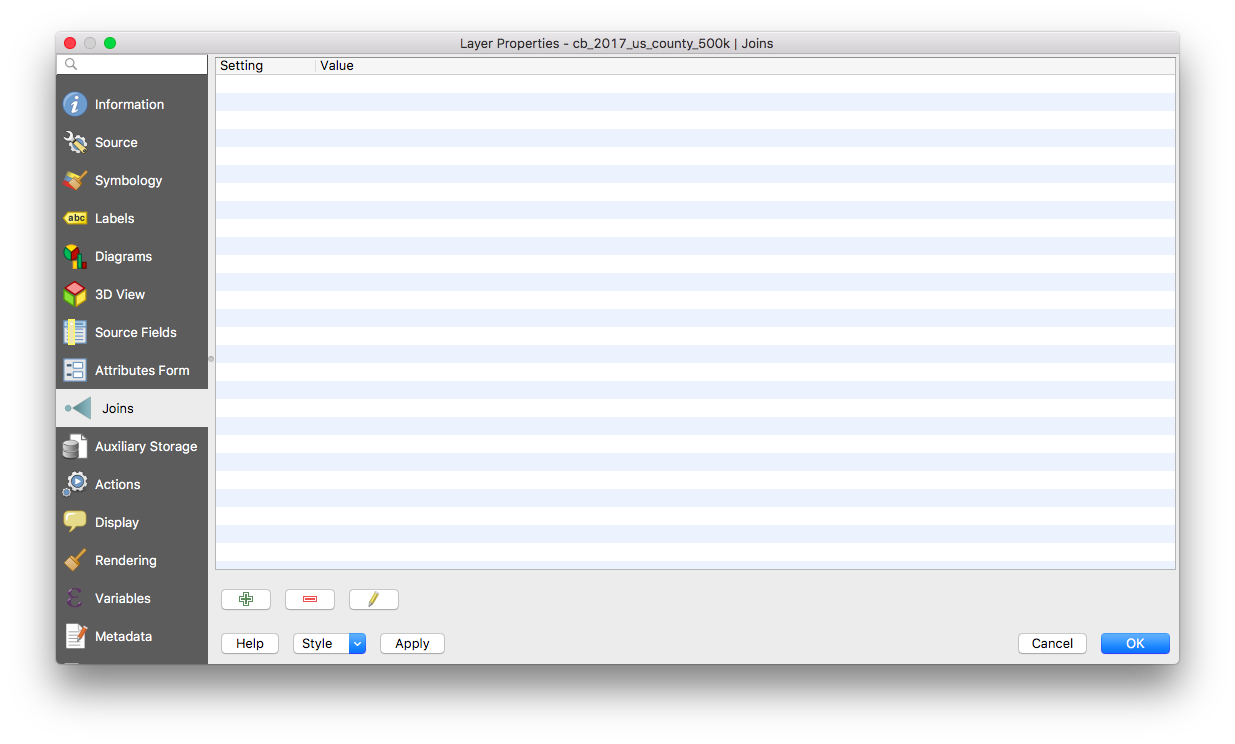
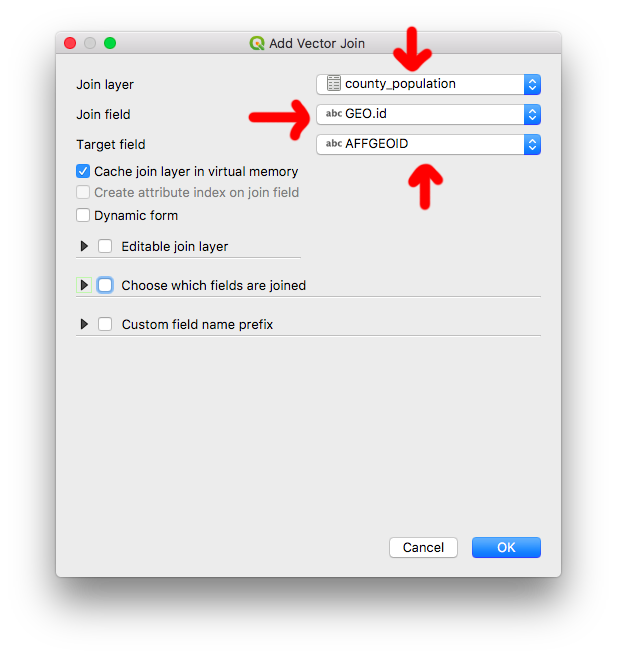
Click the green + button to add a new join, and fill out the screen.
- Join Layer is the layer with your data (your CSV file)
- Join Field is the column you’re matching in your CSV file
- Target Field is the column you’re matching in your shapefile
If you’re making a timeline using TimeManager, uncheck the cache checkbox. If you aren’t using TimeManager, you can leave it checked.
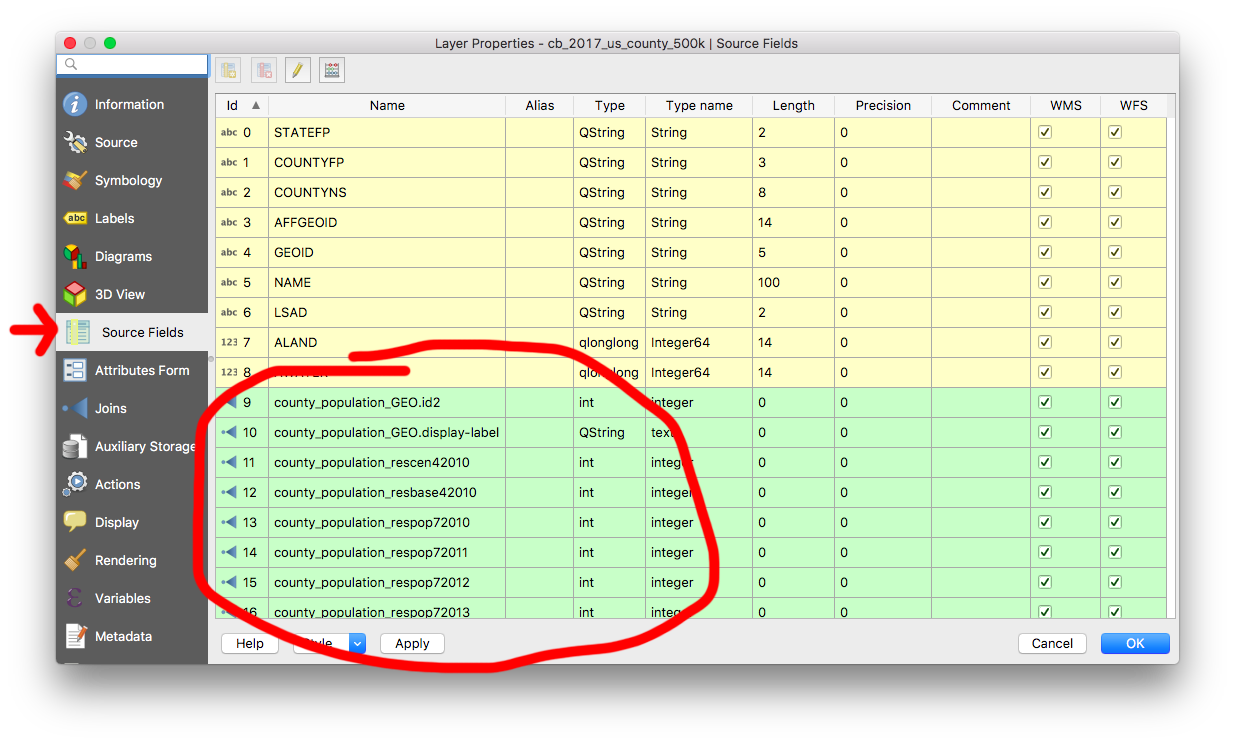
If you click Source Fields on the left-hand side, you’ll be able to see all your new columns.
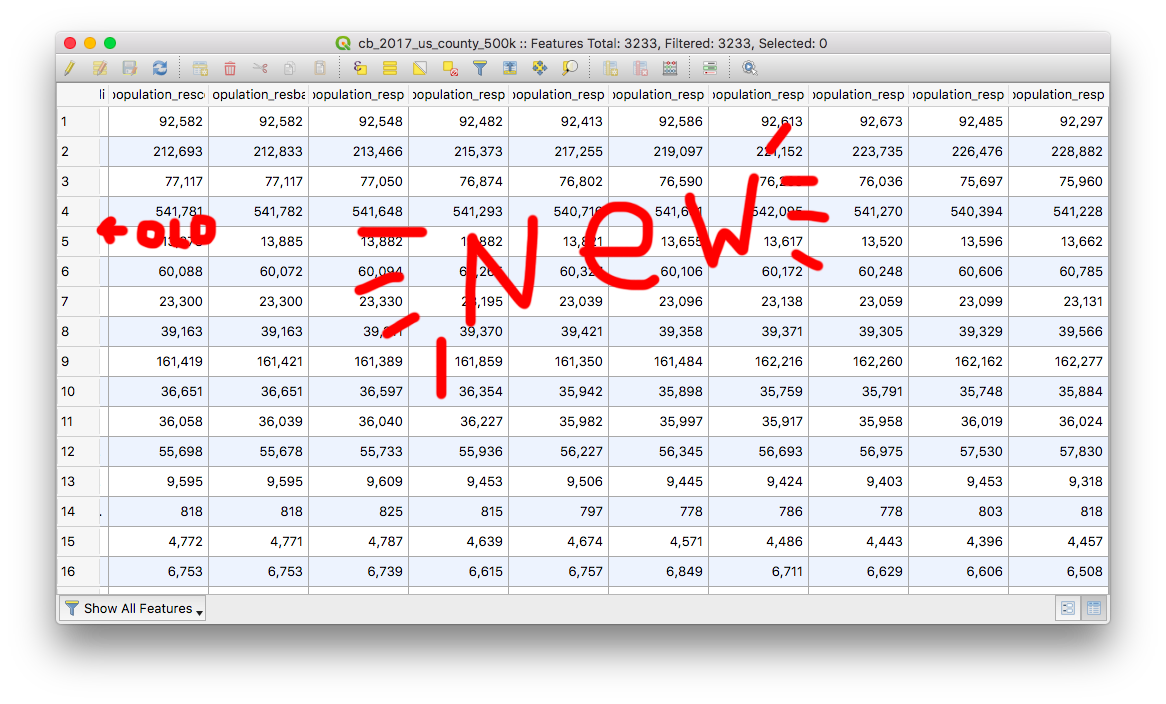
If you right-click the shapefile and go to Attribute Table, you can also see the actual data.
If we didn’t want so many columns to be added? No problem! When creating a join, you can check the Choose which fields are joined box and pick the columns you’re interested in.
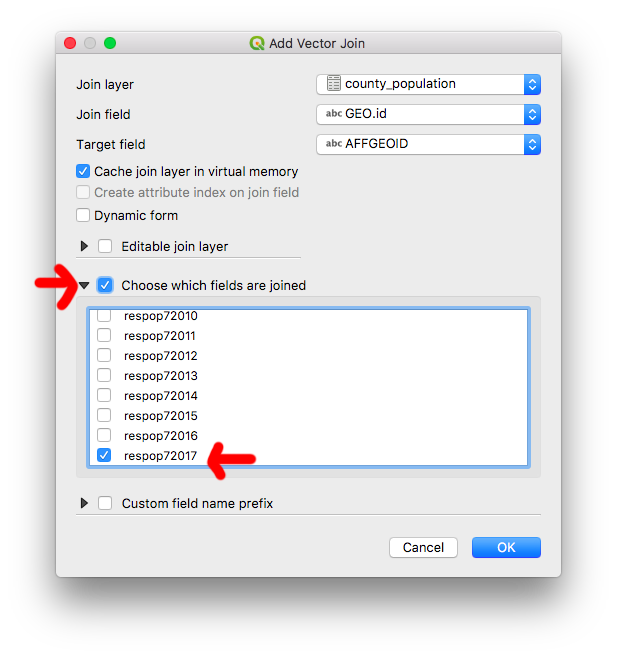
That way you end up with fewer columns to deal with.