Extracting data from jpeg/png charts
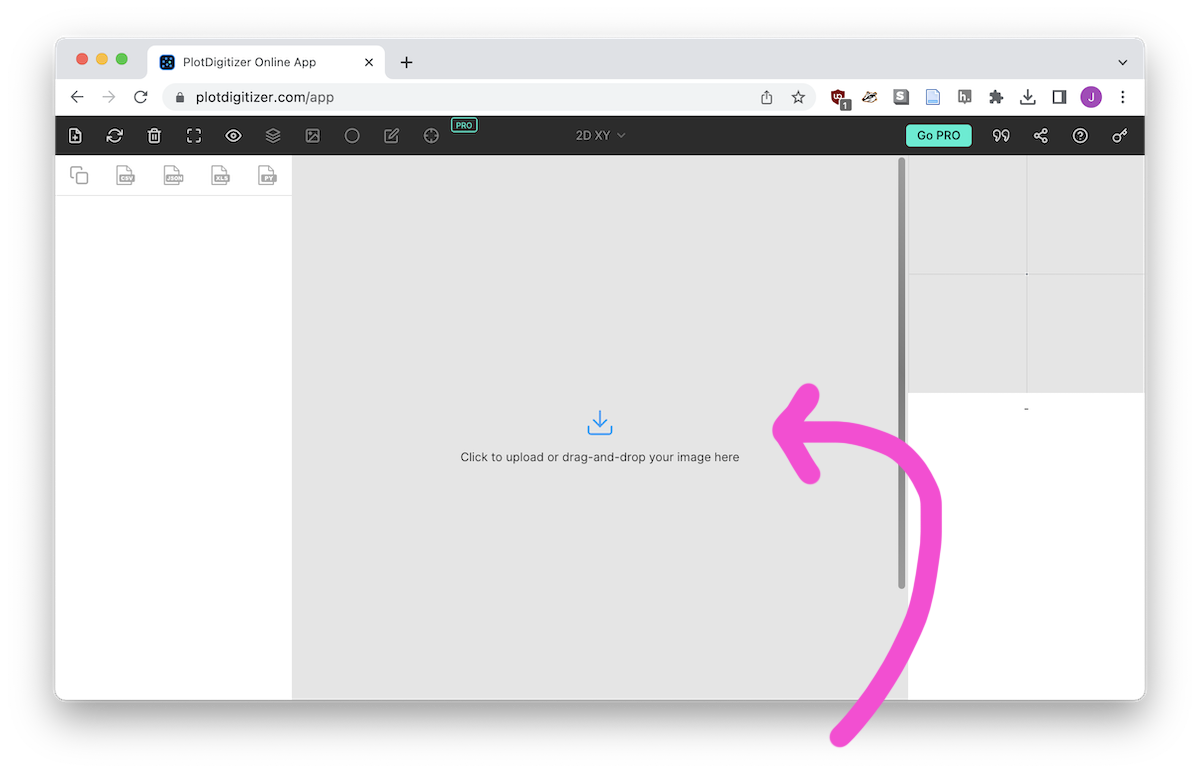
If you have an image-based graphic, I recommend using PlotDigitizer to (roughly) convert it into a CSV file.
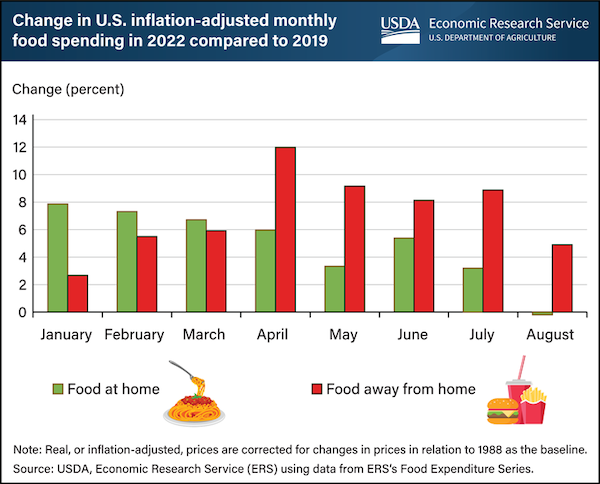
Step 1: Find a graphic
Stacked bar graphs are tough, but you can do them.
You'll want to load up PlotDigitizer and drag it on in.
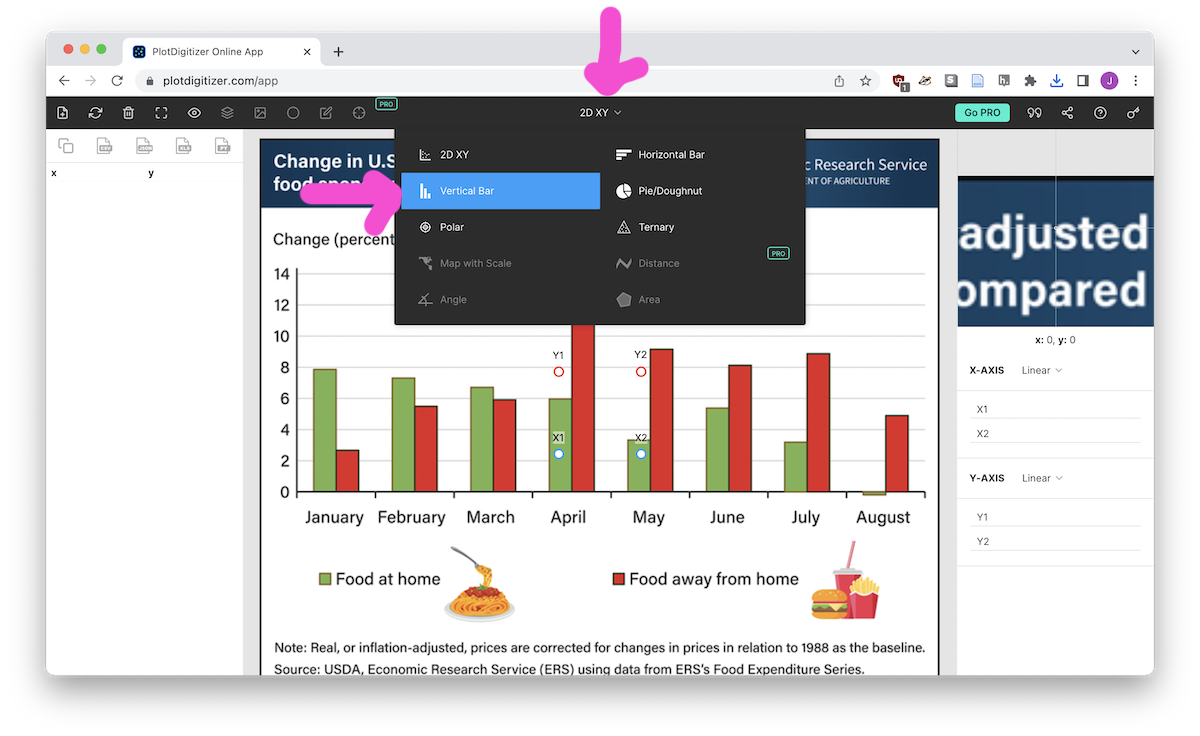
Step 2: Set the graphic type
While our graphic is a bar chart, I've found using 2D XY is best as it allows us to capture both the X and Y axes.
Step 3: Set our boundaries
Y1/Y2 and X1/X2 marks will appear on the uploaded graphic. Drag the circles to labeled tick marks of your axis. Once you have done that, enter the values in the bottom right-hand corner.
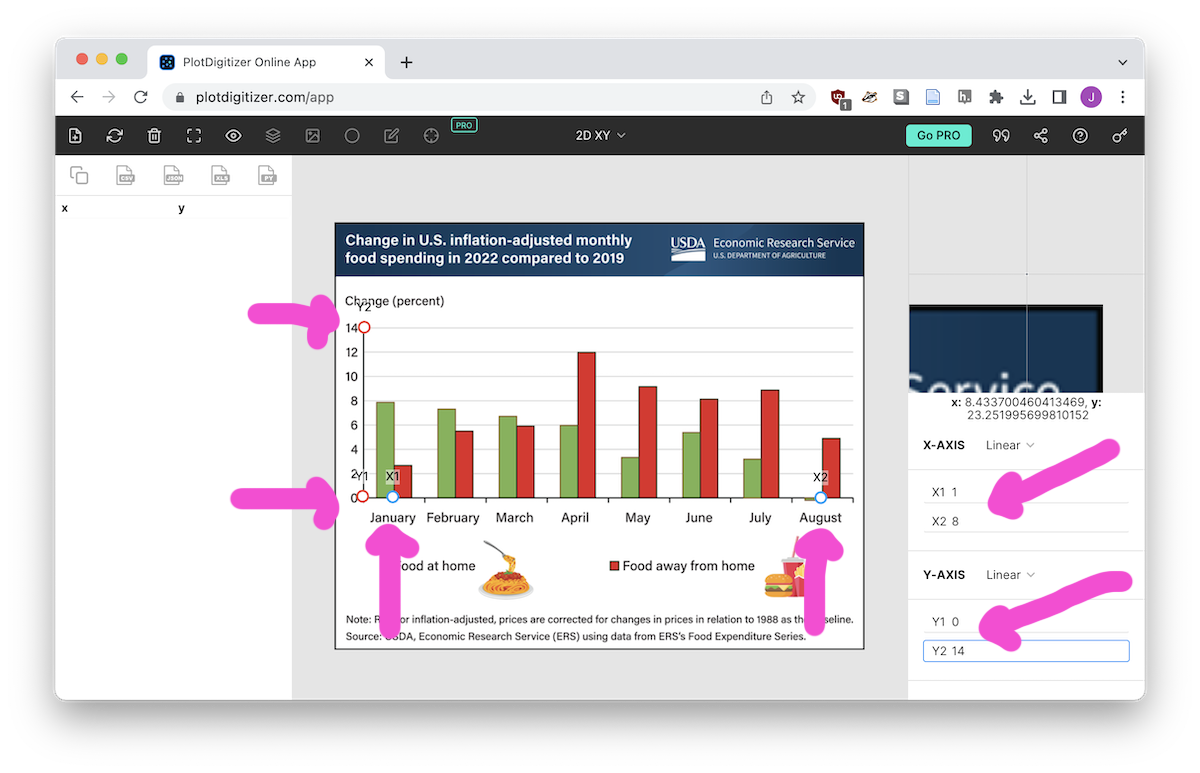
Notice in this case I've marked January as 1 and August as 8. In theory there is a "Date/Time" option but I've never gotten it to work.
Step 4: Marking our data points
Mark the top of each of your bars (or lines, or whatever!).
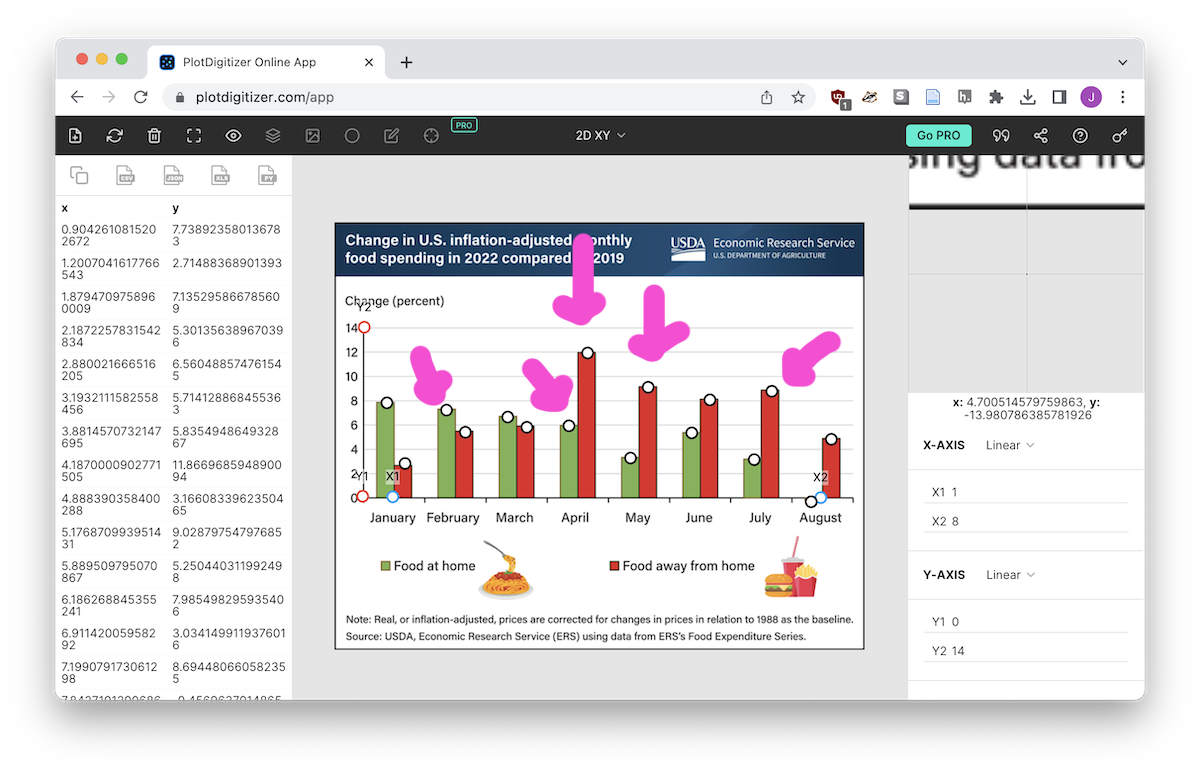
Notice how each mark fills in a row on the left-hand side. Be sure to take advantage of the top right-hand area that shows a zoomed-in view of where you are clicking!
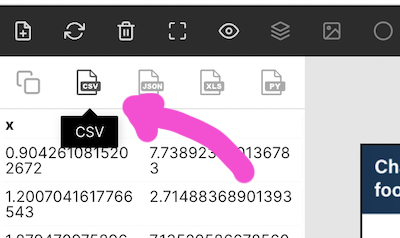
Step 5: Exporting
At the top of the data panel on the left-hand side you have the ability to export in various formats. Click the CSV button and you'll get a CSV!
Step 6: Cleaning up
You might be fine with your CSV as it stands, but I wanted to rename the axes, round the x values to the actual month numbers, and add the "food at home" vs "food away from home" category column.
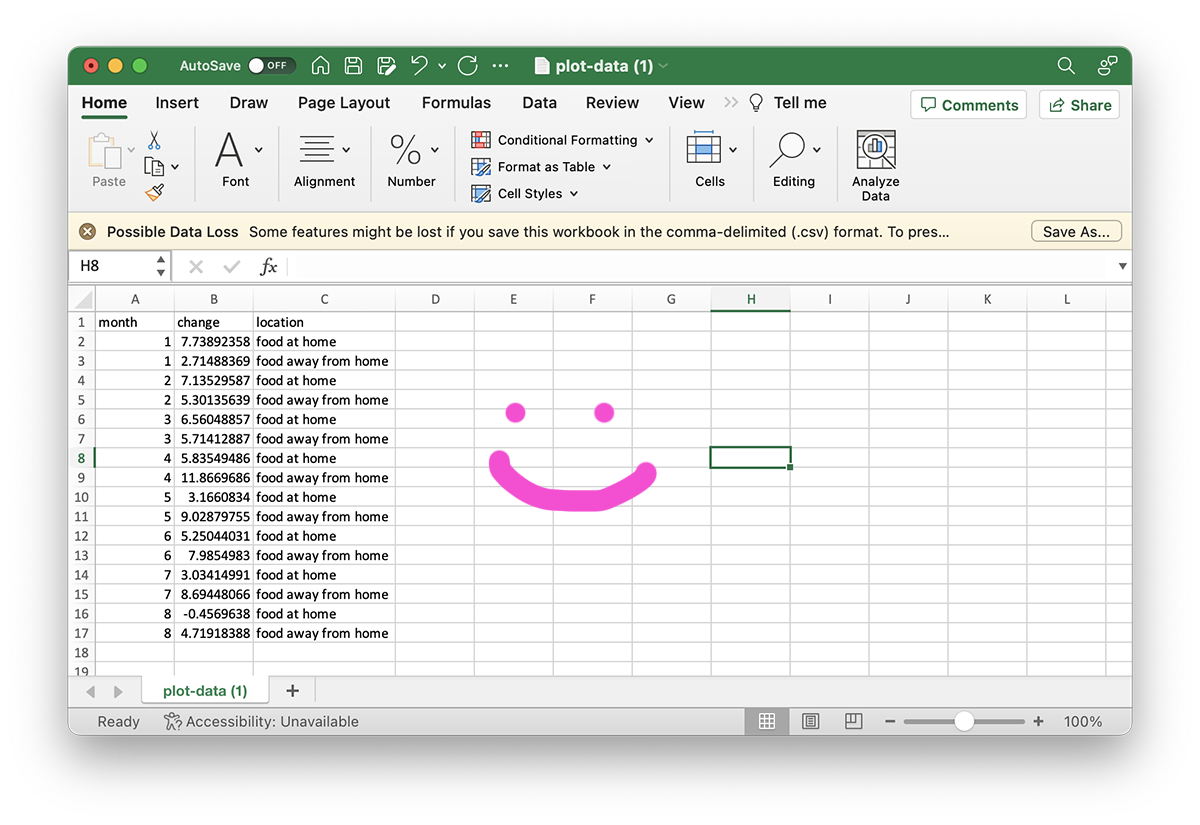
All set and ready for transport to Python, R, or DataWrapper!