統計データ!
私は少し日本語を話します。デモ!この図は日本語で書かれているから日本語で書いています。
ー規則はしかない-クリック!クリック!クリック!おもしろい話はたくさんある、見つけれ。日本人はいつ働いてるか?いつ菓子作るか?だれは犬の散歩をしますか?
「一切」か範疇の名(タイトルの上)をクリックすると大きい分類へ移ります。図の男女をクリックすると男か女のみ見ます。英語で図はありますか?「日本語」をクリックする(上,右)!このリンクも。
私はそまです、ニューヨークに住んでいます。私のemailアドレスは jonathan.soma@gmail.com です。統計局からダータをです。Processingはプログラミング言語の図です。
助けてくれませんか?翻訳が欲しい!図のにほんごは少し恥ずかしいです。これは句のリストです。ありがとうございます!
Japan, right now.
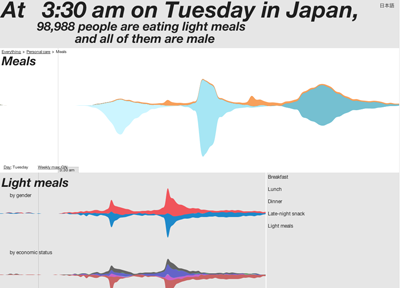
And five minutes ago, in three hours, or at 9:55 on Saturday night. What's Japan up to? Let's find out with some graphs. Let's get specific, too. How many women with part-time jobs are walking their dog at 3am? Yeah, we've got that.
Let's jump right into this: Japan has the absolute best census in the history of my known world. Not only does it include normal things like age, sex, and the height of each of your pets, but it also legitimizes the gossipy question of What Are You Doing Right Now? Japan slapped a bunch of people with notebooks and a sacred Numbers Mission: keep a log of what you do during the day, in fifteen minute intervals. And those people did!
P.S., a default-ly Japanese version of the chart is available at http://www.xoxosoma.com/tokyo-tuesday/jp
Instructions
This is a lot of data, and this is a complicated set of graphs. Let's go over what you can do with it:
- The main panel is a streamgraph of different activities. It's made up of stripes of different activities - Entertainment, for example, has gardening, games, and walking the dog, among others. Hovering over a stripe gets you a count of how many people are doing that activity at that time. If you'd like to get a wider view of the day's activities, there are links above the title - Everything > Category - if you click one of those you'll be popped up a level to see some more data. If you want a more narrow view? Double click on an activity on the main graph or the bar graph to the side - if there are sub-activities, you'll see them.
- Let's say you've hovering over an activity you find interesting - now, click it once!
- After you click, the bottom right fills with graphs about the task you clicked. Now you get to see when it's popular, when no one is doing, and who is doing it. The top graph breaks it down between men and women, and the bottom breaks it down between economic status - people in school, people with jobs, etc. Now, click on 'Female'!
- Now the other two graphs on the page change - they're only reflecting women. If you click, say, 'mainly working' on the bottom graph, now the other two graphs are only working women. Want to compare to working men? Just click on the 'Male' part of the graph, and watch the graphs grow or shrink.
- The top graph might be a little thin now, so what if you want to see it a little closer? There's a set of tools on the bottom left of the main panel - click on Binding-relative sizing to turn it OFF. The graph isn't relative against the total population any more - it moves to fill more space.
- Maybe this value changes between the weekday and the weekend - on the bottom left of the panel, there's an option to change the day. Click it! You can cycle through days, and see how activities change. But maybe what you're looking at isn't very popular on the weekend, and you'd like the see the graph in even greater detail?
- There's a link called Weekly max - click it! Now you're seeing the greatest detail of every day, but the days are no longer relative to each other - they're trying to fill up as much space as possible.
- You're tired of looking at the working men graph? Click Remove bindings and you'll see the complete data again.
- Now, an easy one - just click the graph background. You'll see the time move around. You'll see some fun facts up top.
統計の日 Party facts
OCTOBER EIGHTEENTH IS STATISTICS DAY. In Japan, at least. They even have posters. I don't know if I'll ever be able to breathe again.
There have to be some good bits in there.
- Childcare: Somewhat expectedly, men don't really do it. If you look at "Accompanying a child," though, I think there might be a law that makes Saturday afternoon Men Hang Out With Their Kids Or Pay A Big Fine day.
- Sports: Women like swimming, but men eschew the water for productive sports, which is my favorite Japanese invention.
- Early to bed and early to rise... and early to bed: People start waking up at 5 AM, but are taking naps by 7:30 AM.
- Squeaky clean: As many people are bathing at 1 in the morning as 7 in the morning.
- X-rayz: NO VISITING THE DOCTOR ON SUNDAY.
- TV: People without jobs just watch TV all day. The less lazy ones are gardening.
I've been pretty much blinded by making this for the past couple weeks, so if you find anything great drop me a line.
Who'm I?
I'm Soma, I live in Brooklyn, and I spend much more time baking than anyone in Japan. It's my sworn duty to remind you that I got a D+ in stats second year of college, so most graphing and all analysis should be taken with a toxically large grain of salt. My Japanese was limited to two years in high school, so you'll excuse me if my こわい's and かわいい's don't always line up. Thankfully, the Statistics Bureau of Japan has a beautiful site that translates well more than it needs to.
My never-updated site is xoxosoma.com, and mindless invective can be directed at jonathan.soma@gmail.com. If you like fun and quality charts you might also like my interactive singles map.
Sources
Data is from Statistics Bureau of Japan, specifically the tantalizingly-named Survey on Time Use and Leisure Activities: Results on Activities by Time of the Day (Questionnaire B). I think Questionnaire A was a little less in-depth. In case you can't tell from the graphs, the sample size for some pieces of this aren't so big, so please don't drunk-dial me to win a bet about how many people are walking their dog at 1 AM. I'll add statistical error in and you'll lose your car.
Oh, and most of the translations are from the Statistics Bureau, too. I didn't edit too many, even when trying to make sentences.
Coded in Processing, which is nice and fun and easy.
Lee Byron's paper on stacked graphs, although my maths were only strong enough to make it through the first half.