Create an automatically updating visualization
We're going to use GitHub Actions and GitHub Pages to build an auto-updating website. This is a text version of this video.
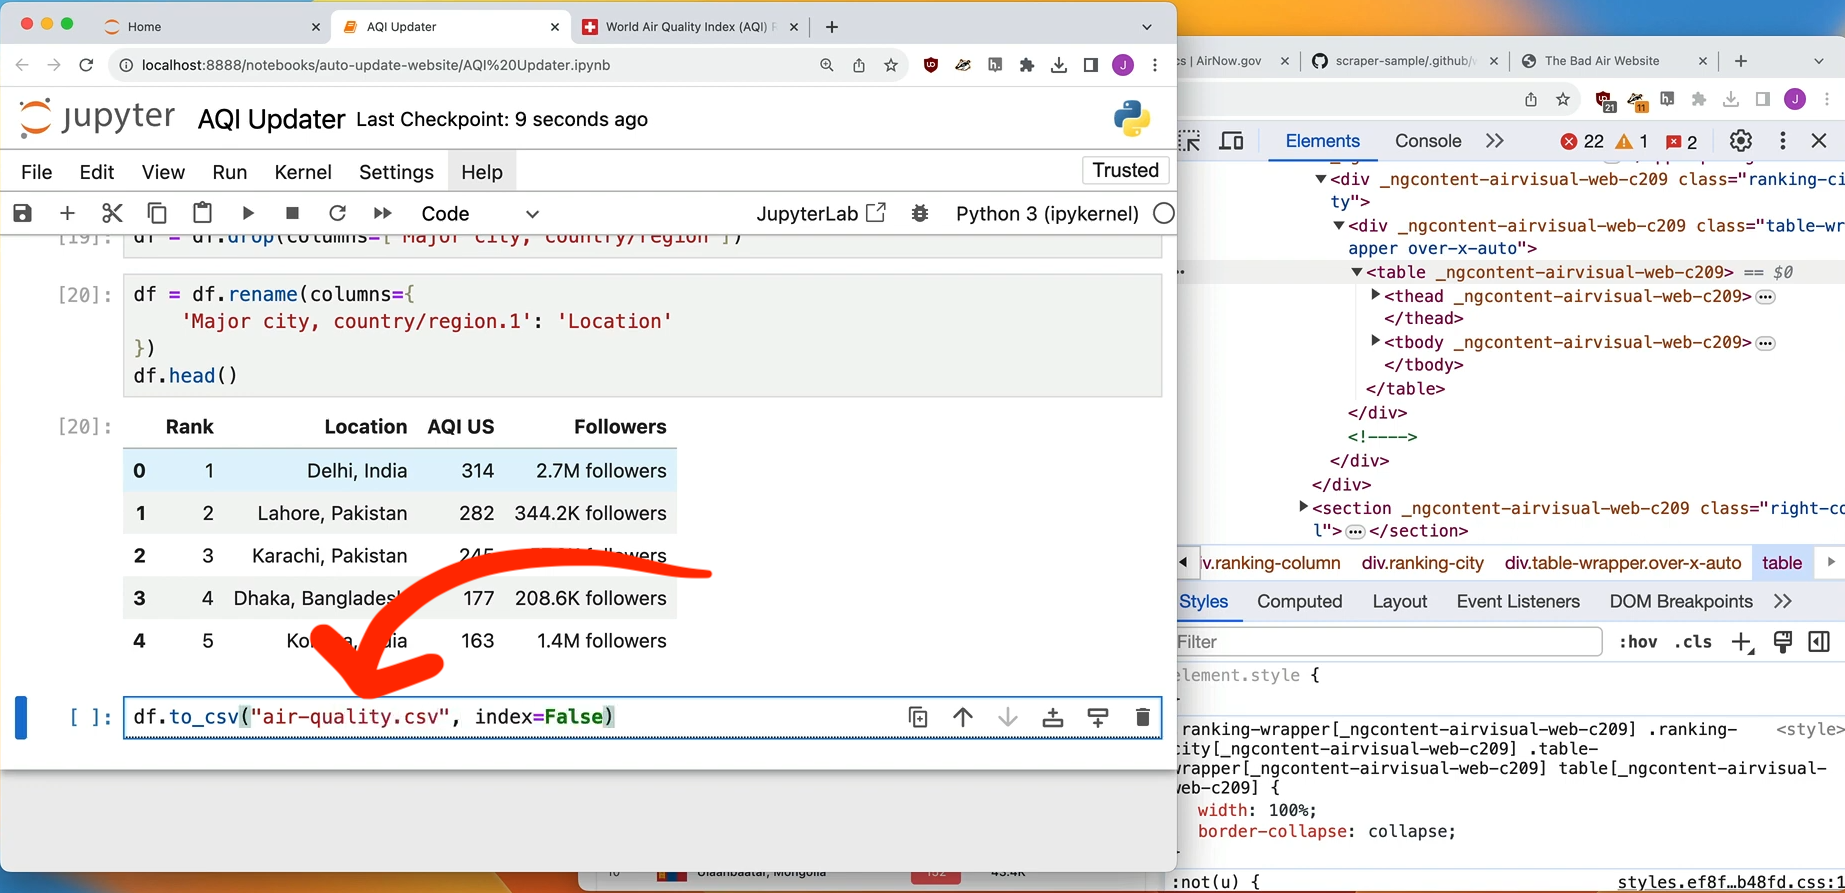
First, write some code that saves the information you want to visualize as a CSV file. In this case it is a Jupyter notebook scraper for IQAir
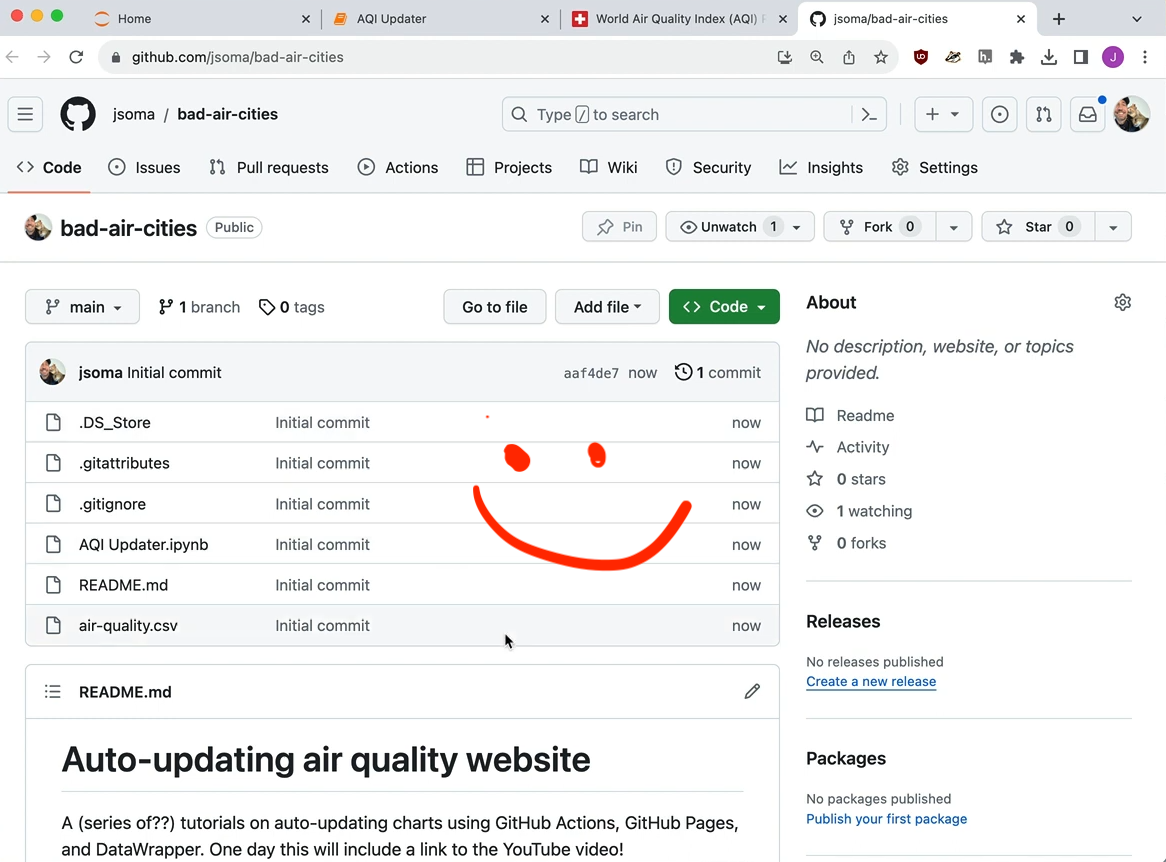
Next, send it all up to a GitHub repository. Mine is located at github.com/jsoma/bad-air-cities.
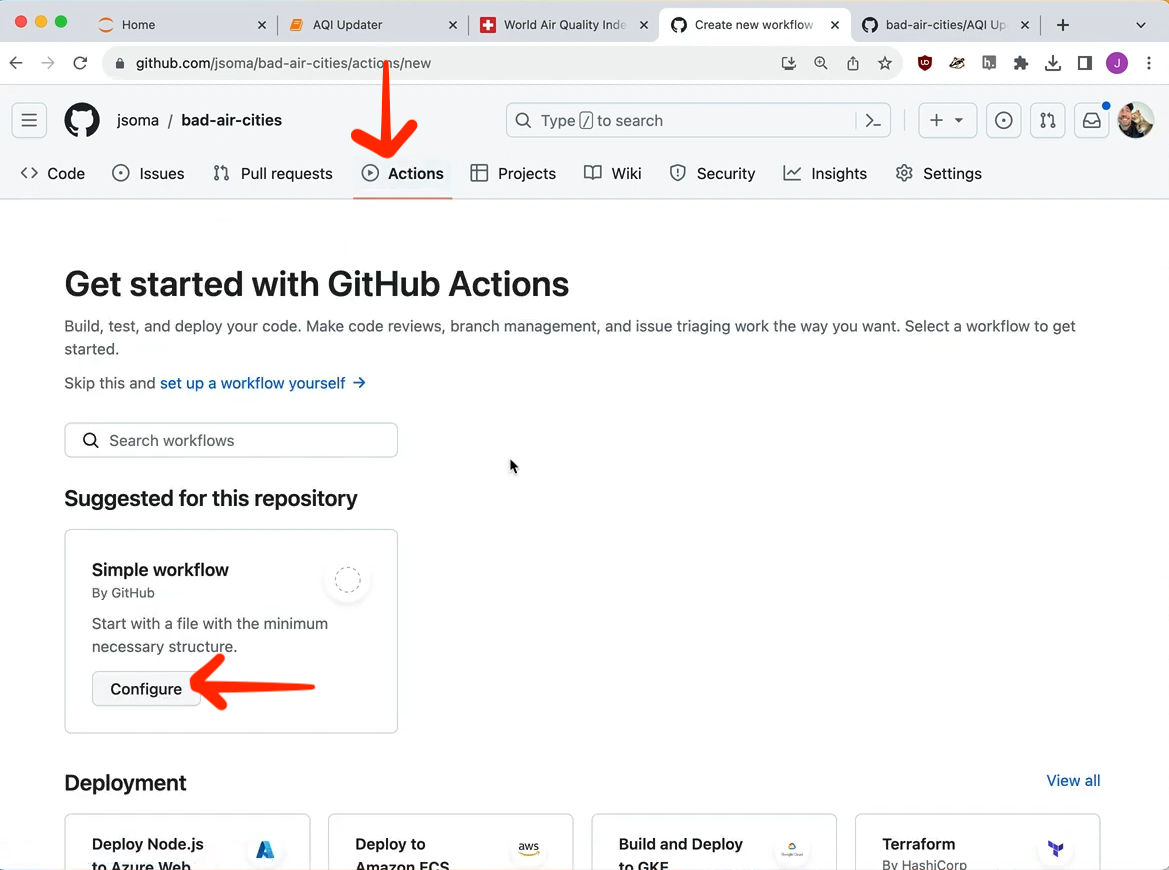
Now set up GitHub Actions - an automation pipeline that works for free - by going to Actions, then Configure.
We don't like any of this code! It's commented weirdly! Instead we're going to copy one from another scraper of mine found here.
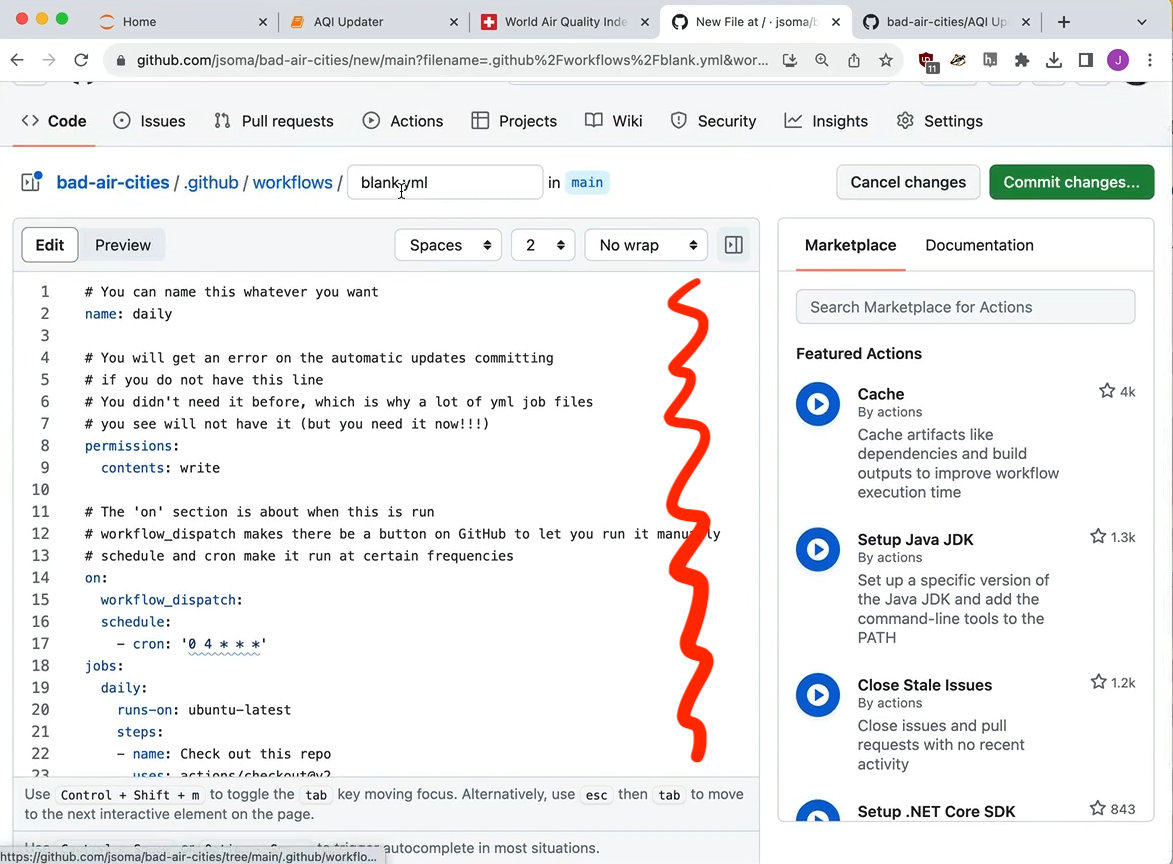
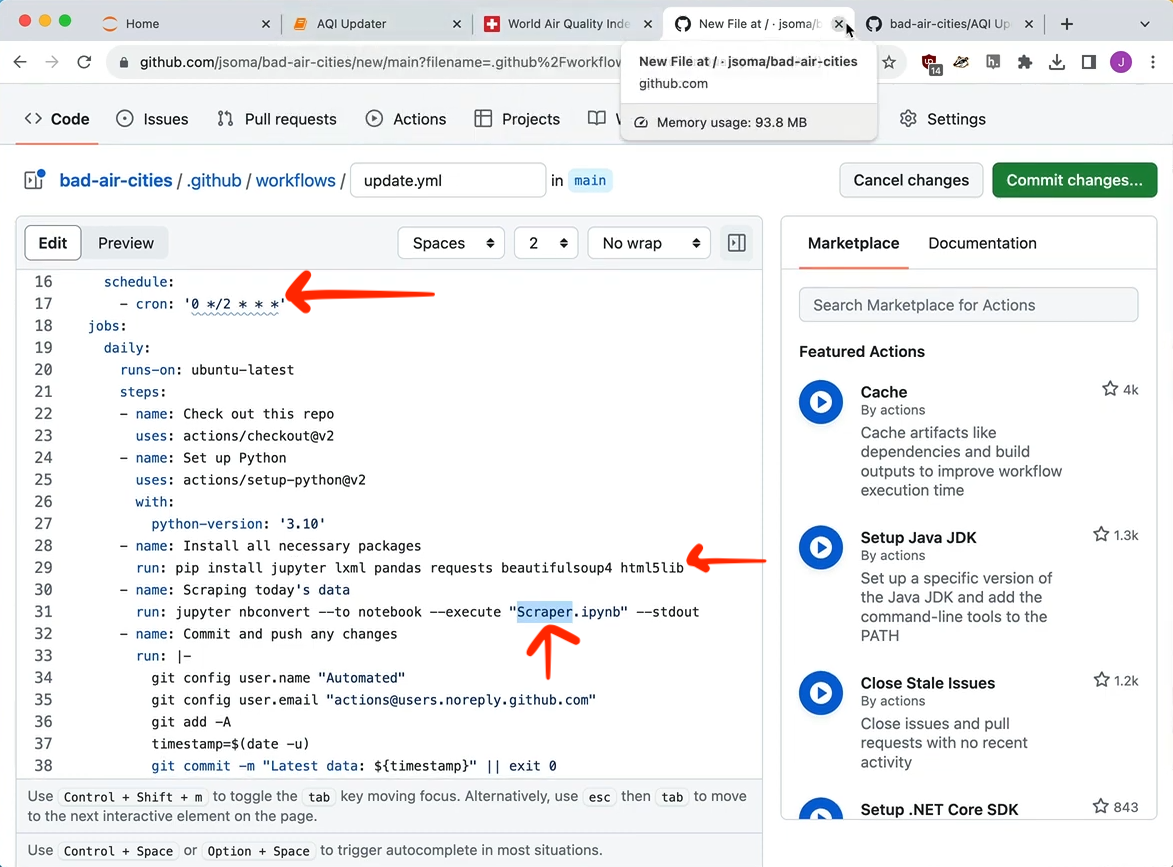
We'll need to make some edits:
cronis how often it runs. You can find a list of cron examples or you can ask ChatGPT about the cron syntax for "every morning at 4am" or "every Tuesday in April."- I am using
pip installto set up requests, pandas, and basic BeautifulSoup scraping content. If you use other libraries you'll need to add them in here. - If you did not name your notebook
Scraper, you'll also need to change the name where we tell GitHub Actions to run it.
Click Commit changes in the top right to save it.
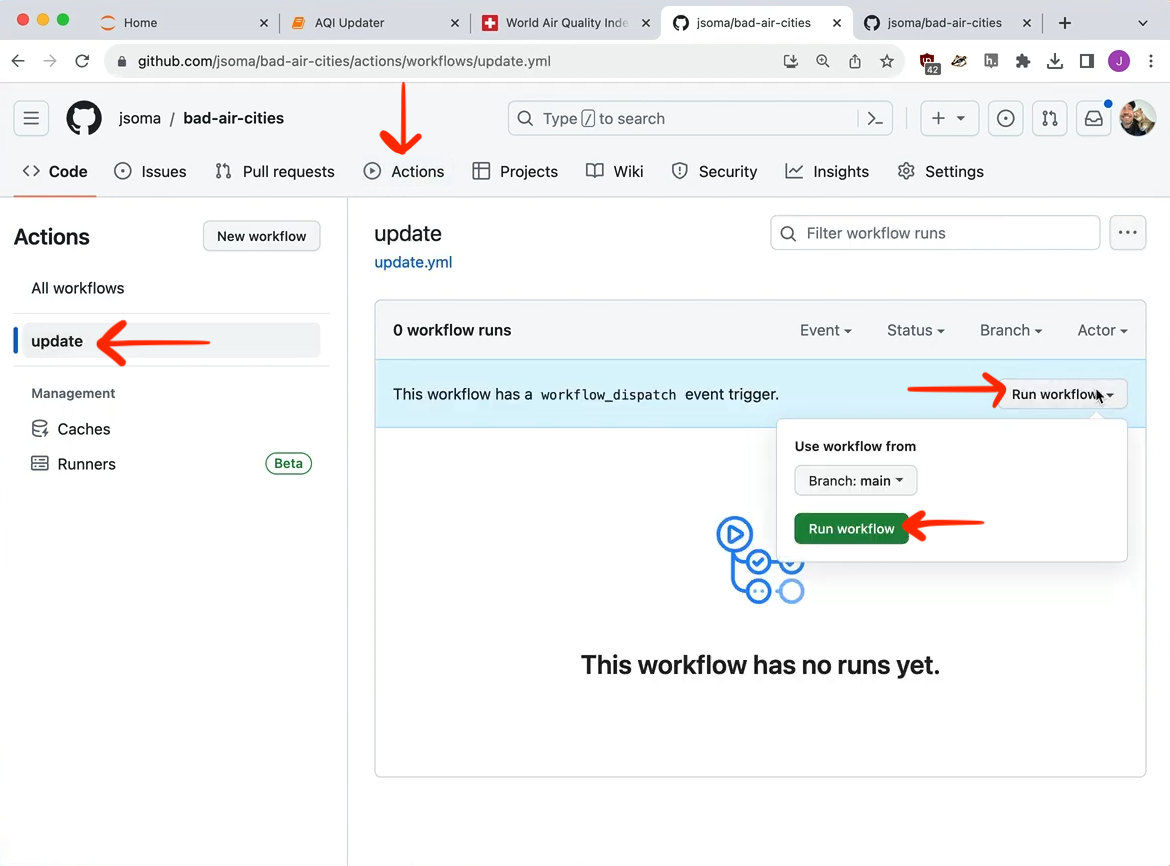
Since we had workflow_dispatch under on in our YAML, we are able to click a button to run the action. Go to Actions*, then click the workflow on the left column, then Run workflow (twice!) on the right.
If you get an error, watch this quick video about how to debug them.
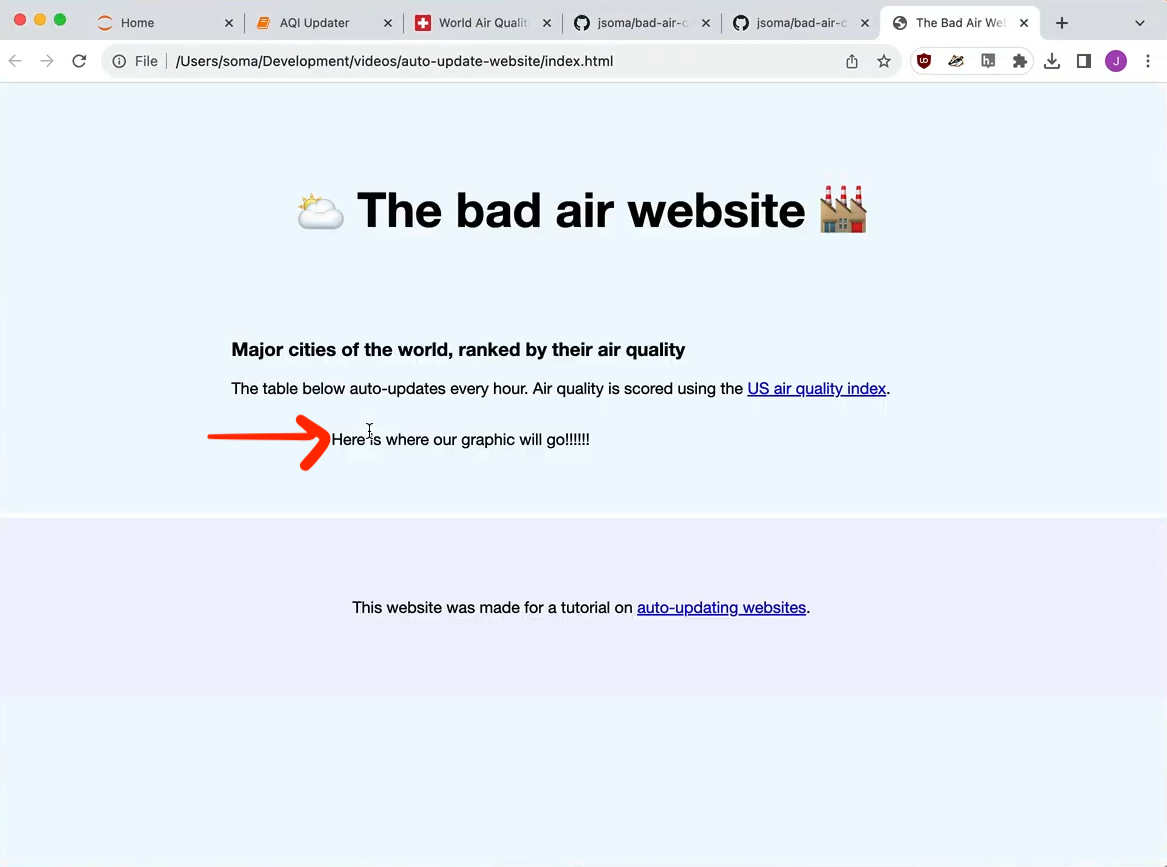
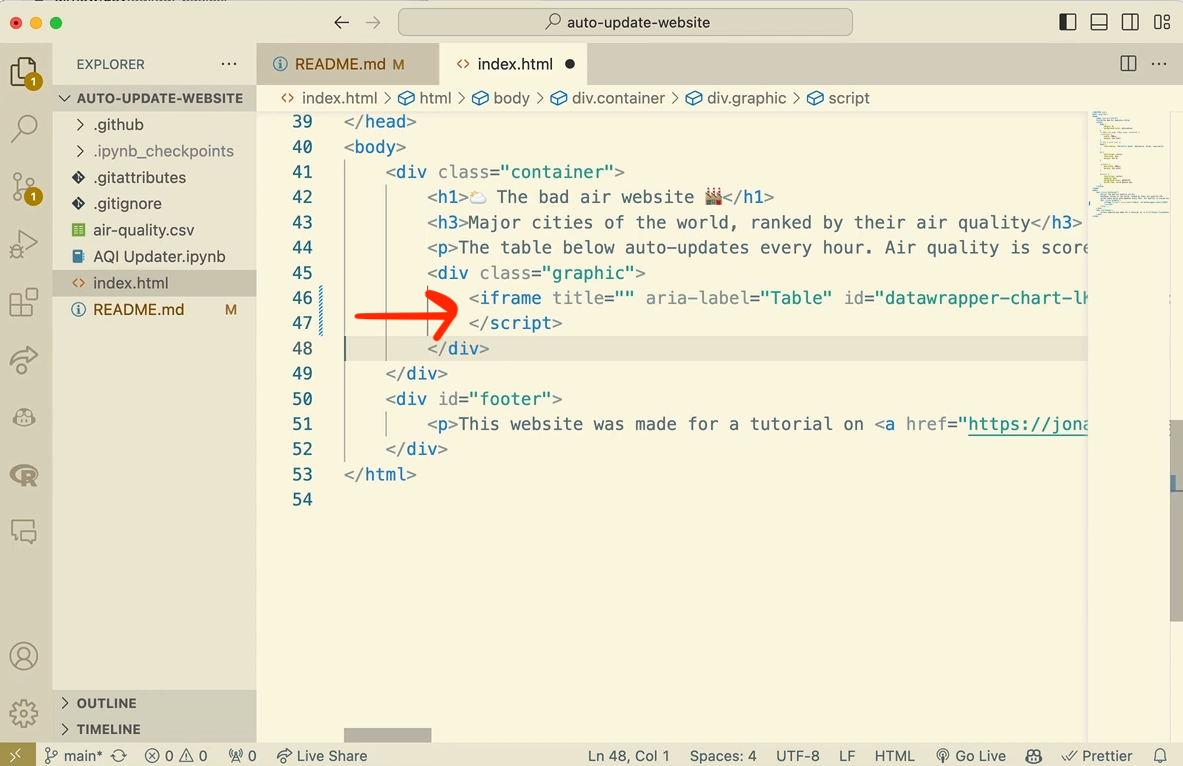
Build a web page that has some sort of placeholder for your graphic. You can find mine here. Call it index.html and put it in your repo.
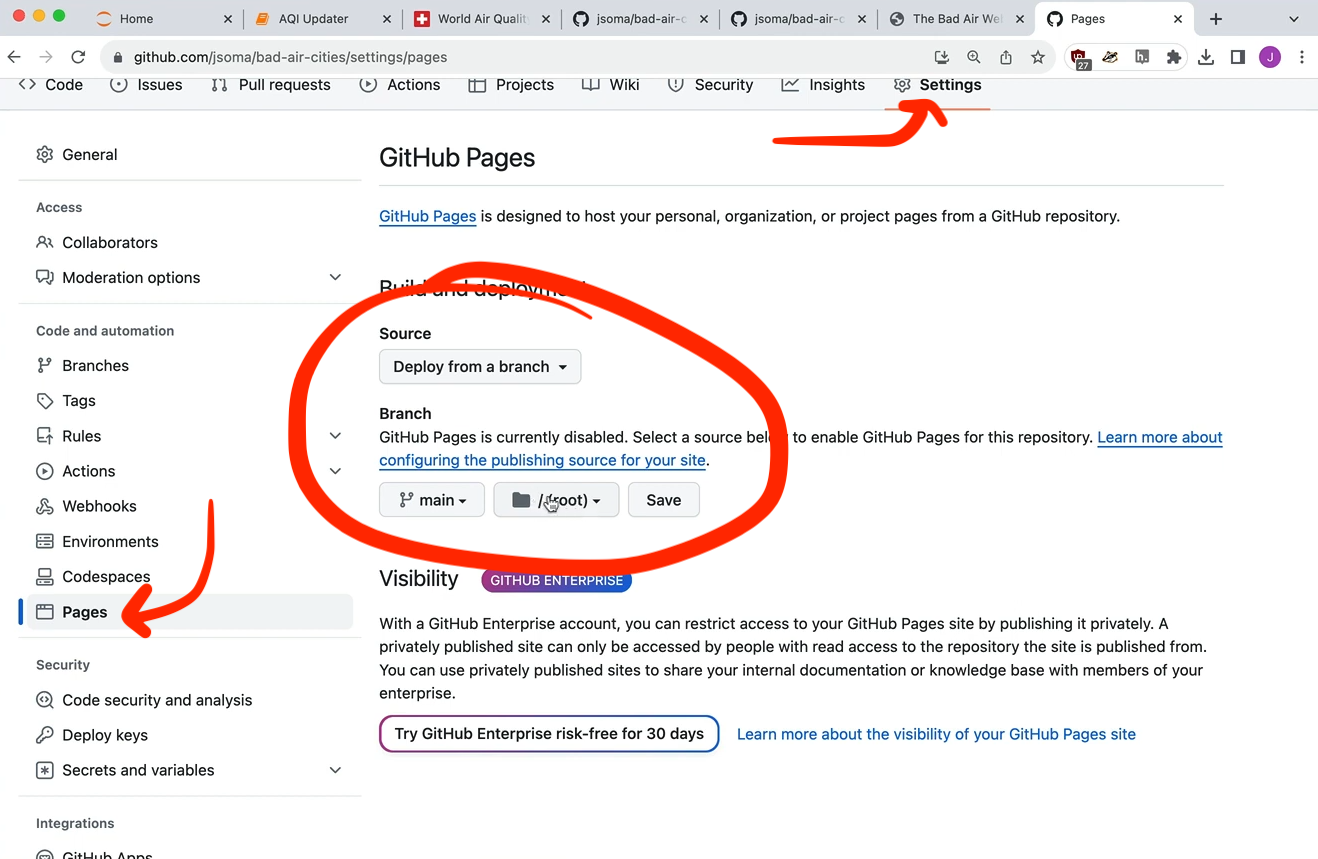
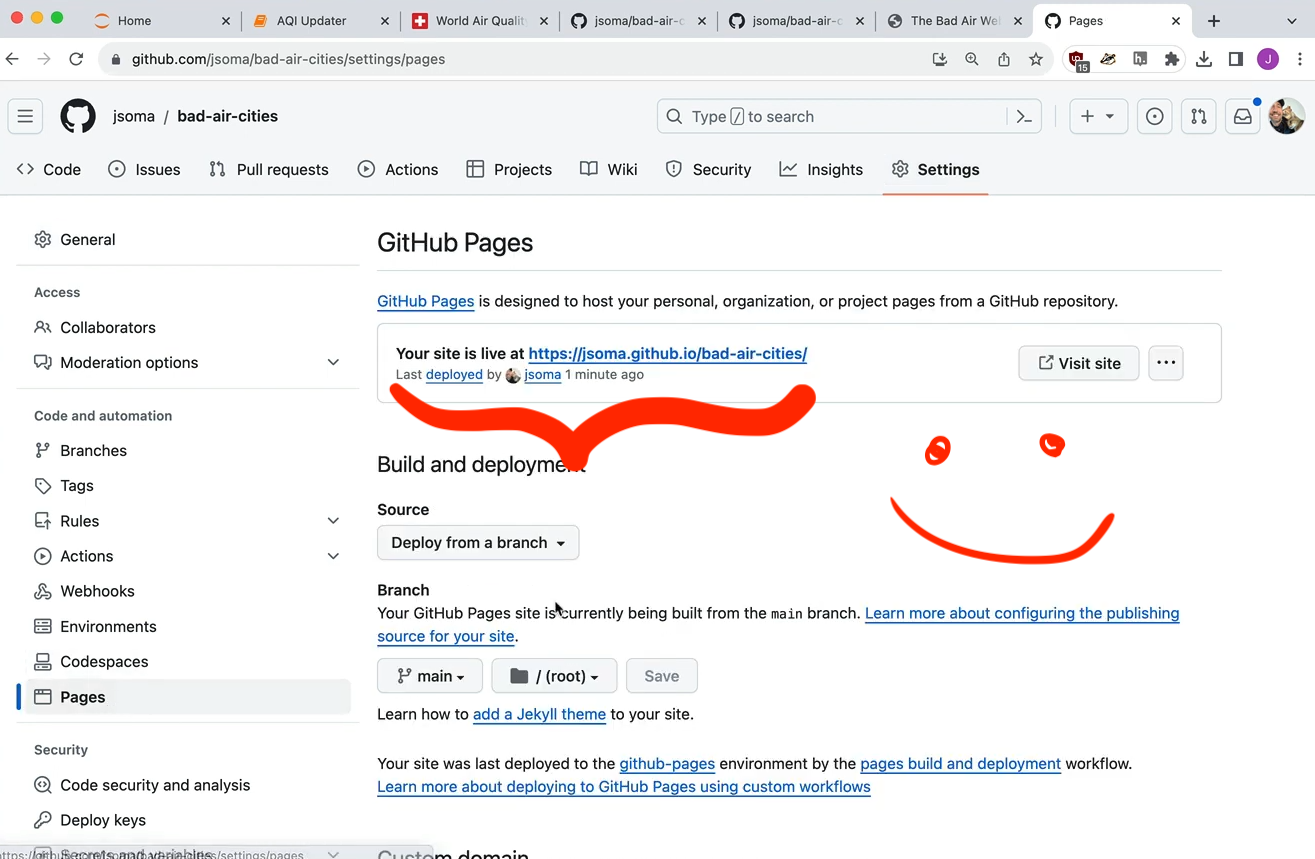
Now let's turn this into a real internet web page: after you push it up to your repo, go to Settings then Pages then set it up to host your page:
- Source should be Deploy from a branch
- Branch should be
main(ormaster) - the folder icon thing should be
/ (root)
Then click save.
After you wait a little (maybe refresh?) it will have pushed it up to the internet and you can see your URL. Mine is https://jsoma.github.io/bad-air-cities/.
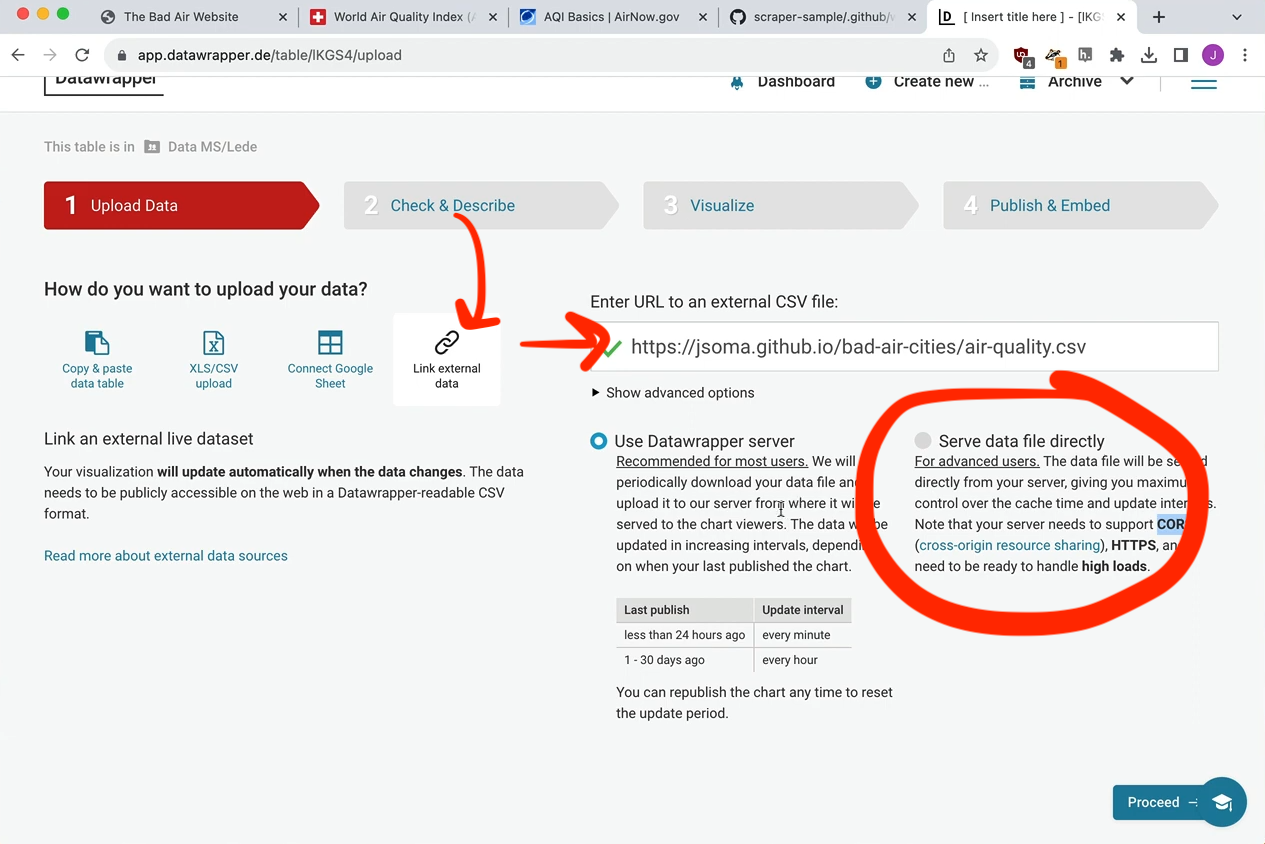
Next, head to Datawrapper to build a graphic. The important part is to use the Link external data option for uploading your data, along with Serve data file directly.
Just add your data file's name after your website URL. For example, if I have air-quality.csv and my website is located at https://jsoma.github.io/bad-air-cities/, my full file can be found at https://jsoma.github.io/bad-air-cities/air-quality.csv
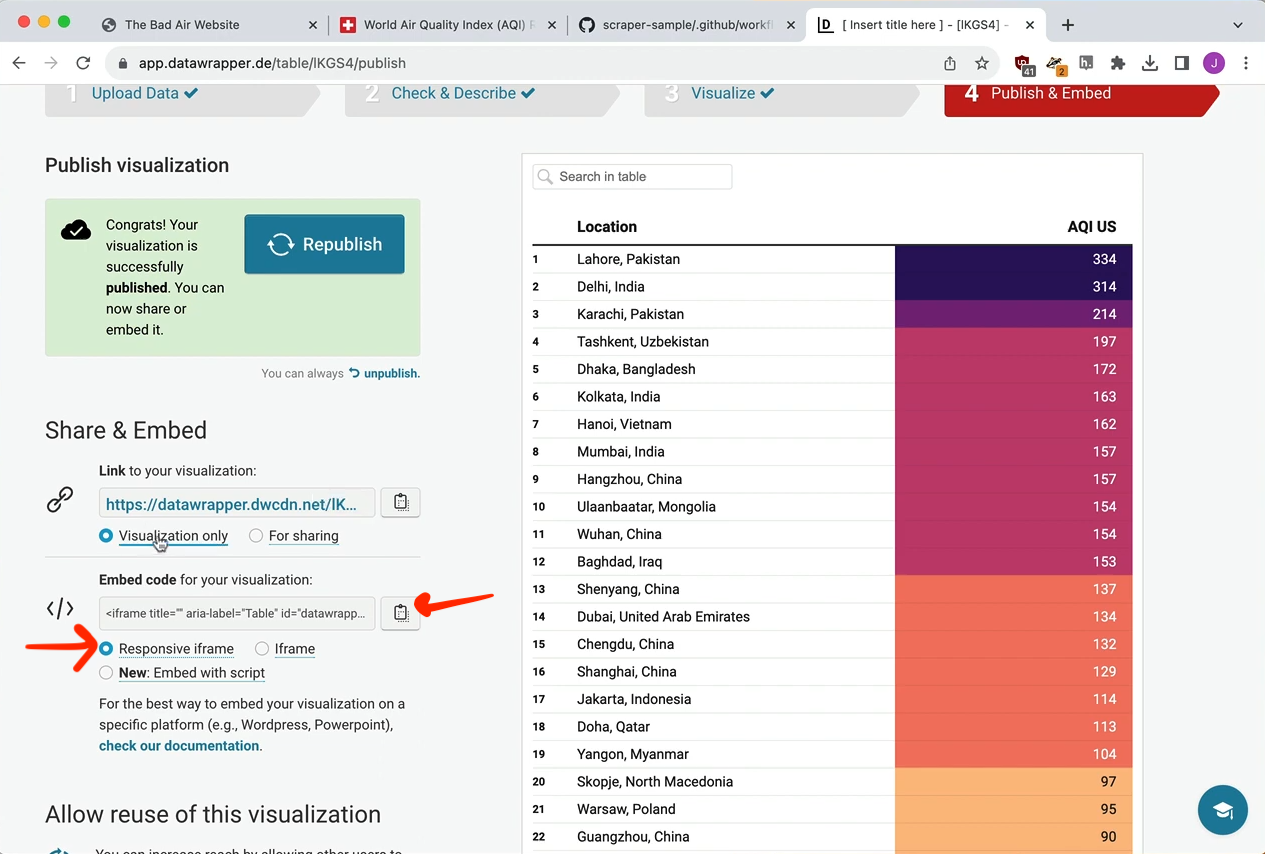
After you step through the viz process, you'll get to the Publish page. Be sure to copy the code for the Responsive iframe.
Paste this into the placeholder section of your page.
Save it to your repo, wait a few minutes for GitHub to update the website, and voilà! An auto-updating website!
